INSTRUMENTS > PRODUCTS > GRM-ONE-SERIES > FEATURES
GRM-ONE-SERIES
NUMBER OF ADMINSTRATORS & USERS
Admin:
Has authority over all settings of the cloud software. One administrator per IoT gateway.
User:
Can view all measurement screens. No limit in number of users.
LOCATION VIEWS
Graphtec will provide all set up for the cloud platform
Displays location information of the facilities where IoT gateway is installed on a map. Multiple facilities can be viewed on one screen.
Facilities will be displayed with a blue marker normally and placing the cursor displays the current value.
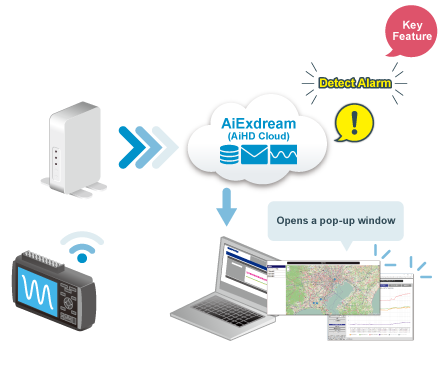
A red marker will be displayed on a map when alarm is triggered.
MONITOR THE MEASUREMENT DATA FROM REMOTE LOCATION
Displays data measured in designated period of time at designated facility in waveform, digital values, and the map. Display can be viewed by location, date (daily, monthly, annual reports), and duration.
REAL TIME CAMERA IMAGE FROM REMOTE LOCATION
Get a better grasp of the situation in the remote location with the real-time camera display on top of the signal waveform and data. Specified network camera will display live streaming video. Click on a particular historical data and the streaming video data will pop up. One network camera can be connected with IoT gateway.
ALARM REPORTING FEATURE
When alarm is triggered, GRM-One will send alarm email to registered email addresses.
History of alarm is available for review and you can add comments to each incidents.
ALARM LIST DISPLAY
Refine search and display only applicable alarms.
AUTO WINDOW POP-UP FEATURE TRIGGERED BY ALRAM
Pop up a map or a graph when an alarm is triggered.
Available with premium edition
SEND EMAIL WARNING
REPORTING FEATURE WITH THE ALARM CONDITION
Alert email with PDF report is issued when alarm condition is met. Get to know your anomalies immediately.
REMOTELY CONFIGURE AND OPERATE GL SERIES
Operate GL located in remote places from a distant location.
GL7000, GL980, GL2000, GL240 and GL840 series
Built-in WEB server function on the instruments allows users to change settings and operate remotely. The main body image of the GL will be displayed on PC browser.
GL100
GL100 web feature has dedicated screen with measurement range setting and recording start/stop controls.
DOWNLOAD FEATURE FOR MEASUREMENT DATA FILES
Download in CSV format
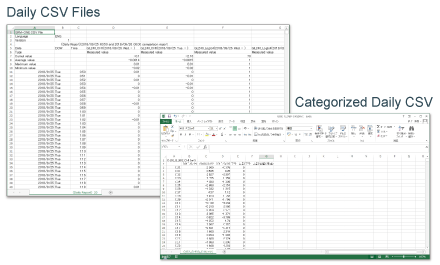
Download measurement files saved on the cloud server in CSV format. Daily CSV Files Data measured in designated time interval for designated facility is outputted in CSV. (Available with statistical calculation)
Categorized Daily CSV Itemized data measured in designated period of time at designated facility can be outputted to CSV.
Download data saved in GL to client PC remotely
Download the measurement data saved in GL to client PC by using FTP function installed on the GL. Suitable for recording data with high speed sampling.
REPORTING FORMATS INCLUDING EMAIL REPORTS
OUTPUT PDF FORMATTED REPORTS
Data measured in designated interval at designated location can be put out to a PDF file.(With statistical calculation)
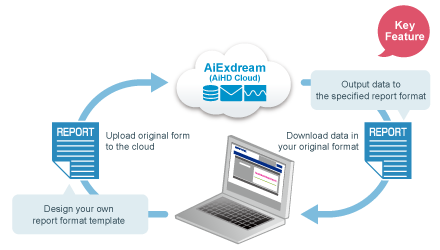
CUSTOMIZED REPORT FORMATS
Only Available on Premium Edition
Once the original report format is uploaded onto the cloud server, the format will be available for download and eliminates the need to edit original CSV data format.
AUTO REPORT EMAILS
only available on premium edition
Auto-distributes measured data (PDF) at specified time.
DATA REPORT OUTPUT FUNCTION IN PDF CAN BE SECURED WITH PASSWORD
Only Available on Premium Edition
For additional security purposes, passcode can be encrypted on the PDF report file.
INSTRUMENTS > PRODUCTS > GRM-ONE-SERIES > FEATURES


